Collect session feedback
-
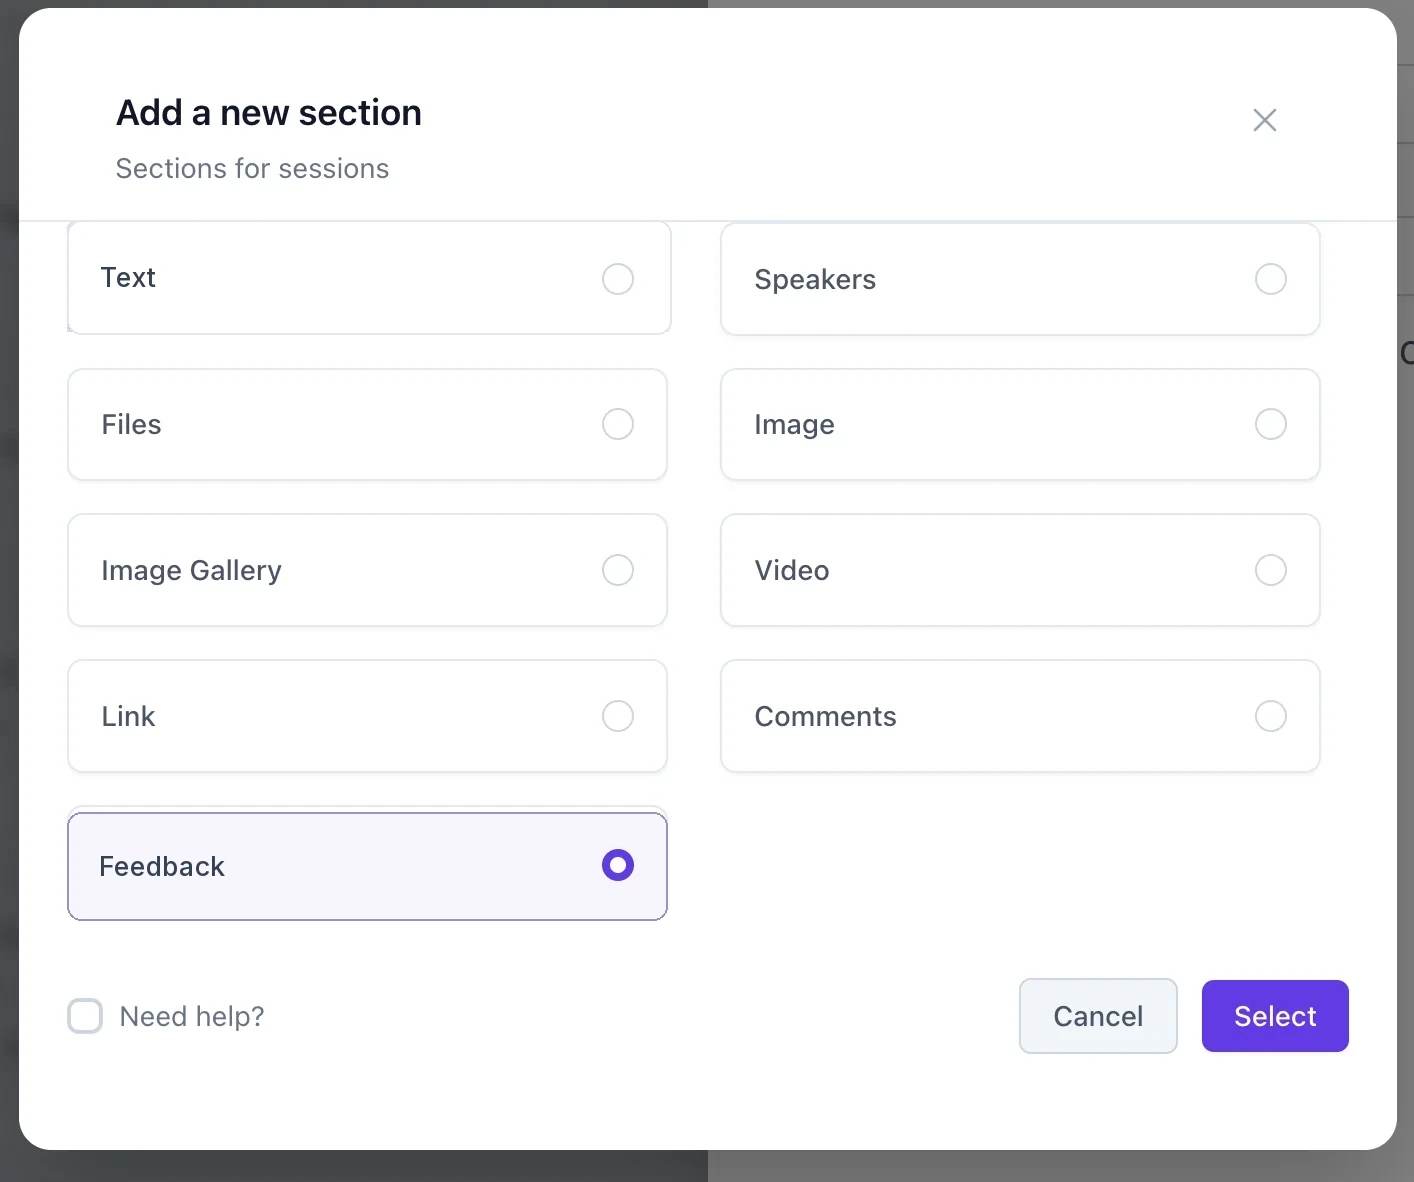 Add a Feedback sectionOpen the session, click Add section, pick Feedback and click Select.
 -
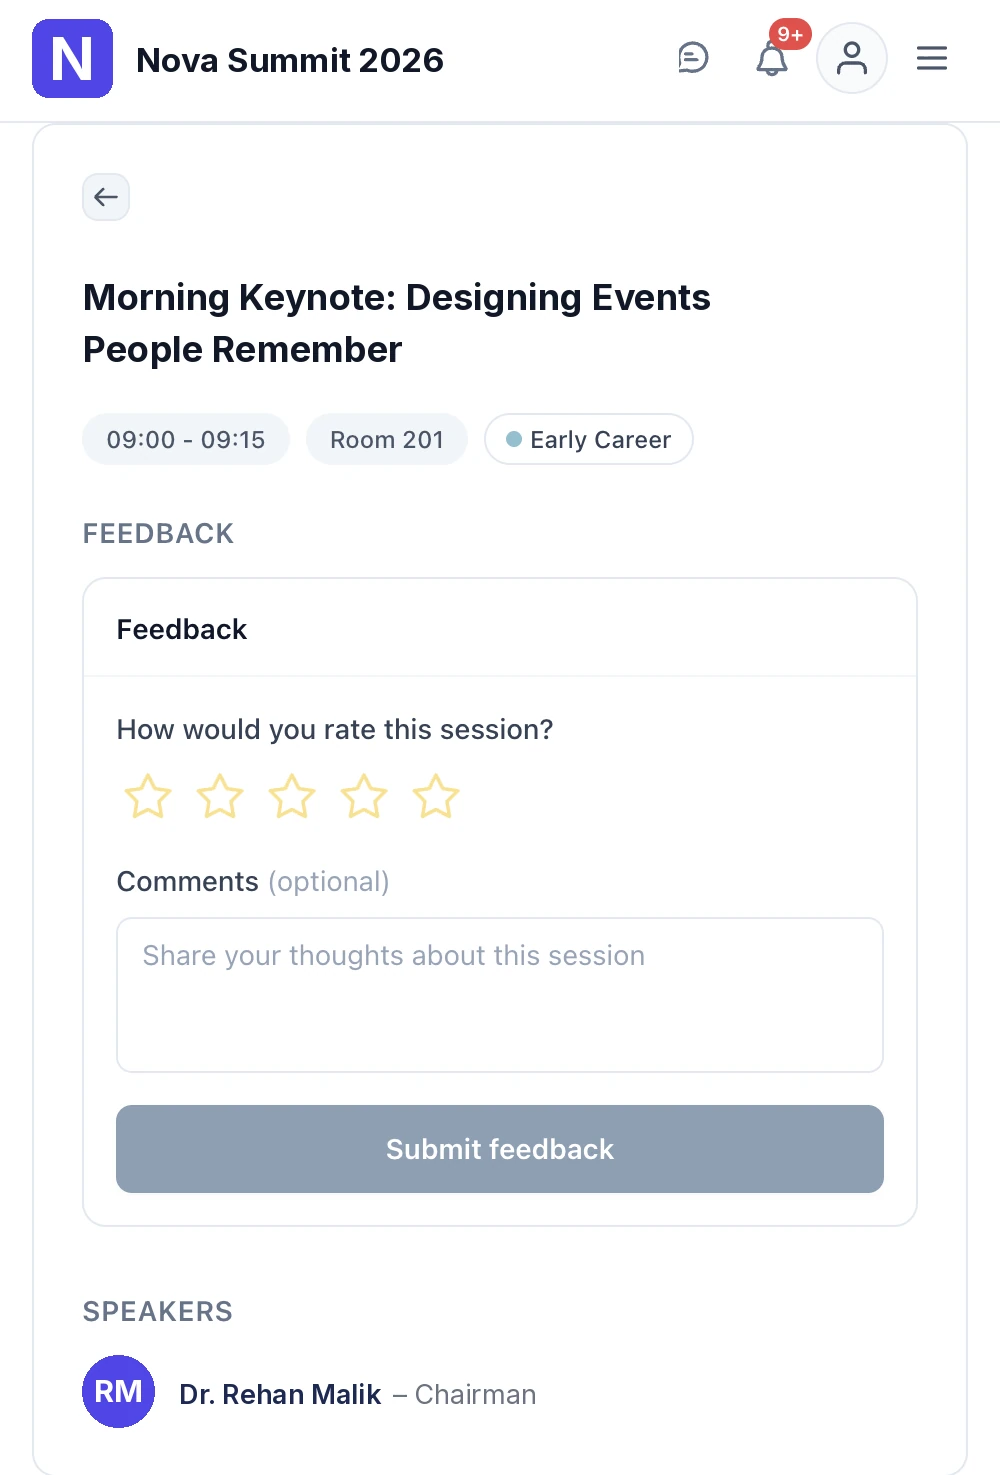 What attendees seeFive stars, an optional comment, and a Submit button that stays inactive until they pick a rating.
 -
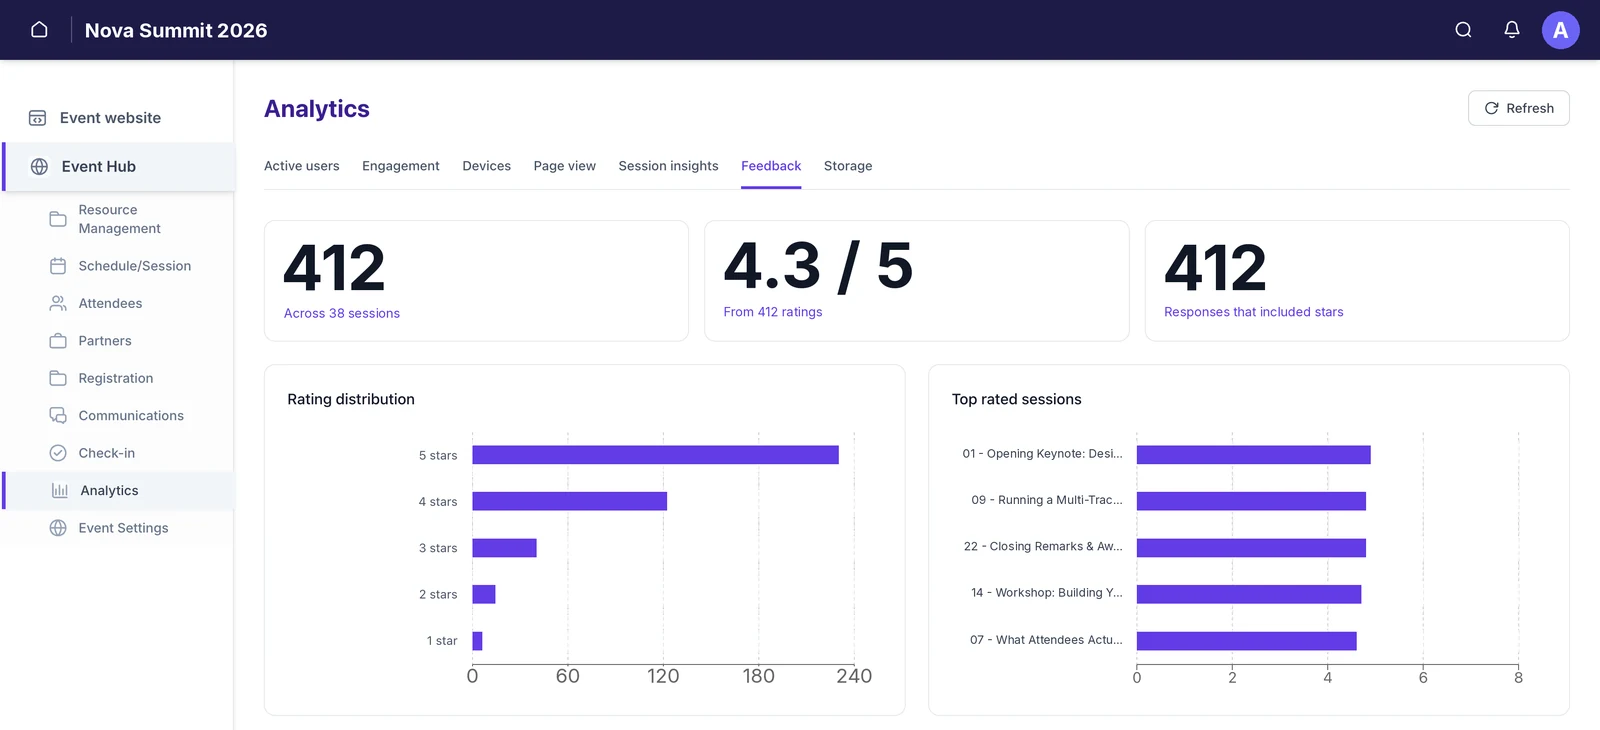 Read the summaryAnalytics → Feedback gives totals, an average, a rating spread and your best-rated sessions.
 -
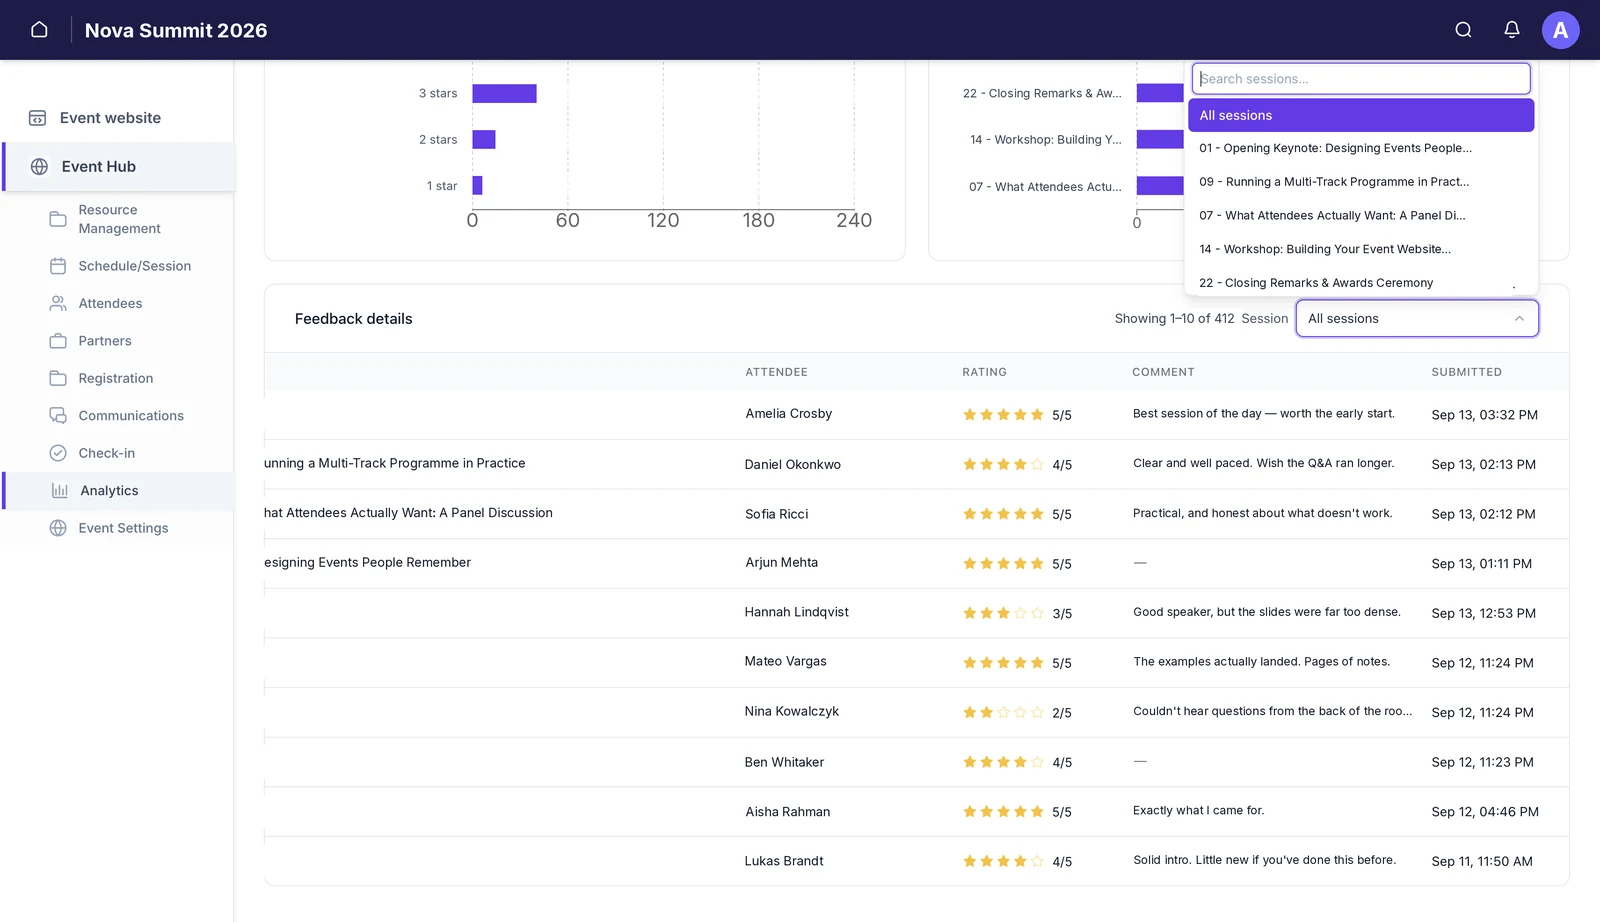 Go response by responseFilter the table to one session to see exactly who rated it and what they wrote.
-
Add a Feedback section to the session
Feedback is a section, added one session at a time — there is no event-wide switch that turns it on everywhere. A session without a Feedback section simply shows no feedback card.
From the Event Hub sidebar, open Schedule/Session, click Manage session on the schedule you want, and open the session. Click Add section, choose Feedback, and click Select.
Feedback sits alongside the other section types — text, speakers, files, media, links and comments. Because it is per-session, you can be selective. Rating the keynote and the workshops is useful; asking people to rate the coffee break is not.
-
Check what your attendees will see
On the session page in the attendee app, the Feedback card sits under the session title, above the speaker list. It asks “How would you rate this session?” with five stars, then offers a comment box marked optional.
The attendee view: a rating, an optional comment, and nothing else to fill in. The Submit feedback button stays inactive until a star is chosen, so the rating is what carries a response — a comment on its own will not send.
It is two taps from a session an attendee already has open. That matters more than it sounds: the response rate on an in-app rating is not comparable to a post-event email survey, because nobody has to leave what they were doing.
-
Read the summary in Analytics
In the Event Hub sidebar, open Analytics and select the Feedback tab.
Three summary cards, then the spread of ratings and your best-rated sessions. Three cards run across the top:
- Total responses — how many were submitted, and across how many sessions.
- Average rating — the mean, out of 5, and how many ratings it was calculated from.
- Ratings given — labelled responses that included stars.
Below them, Rating distribution breaks the responses down from five stars to one, and Top rated sessions ranks your sessions by score.
Read the distribution before the average. An average of 4.3 can mean everyone thought a session was fine, or it can mean most people loved it and a handful had a bad experience — and those are different problems. The chart tells you which; the average does not.
-
Go response by response
Scroll to Feedback details for the raw list: one row per response, with the session, the attendee, the rating, any comment, and when it was submitted.
The Session dropdown is searchable — useful once a programme runs to dozens of sessions. Use the Session dropdown to narrow to one session. This is the view to open when a chair asks how their session landed, or when a low average needs explaining.
The comment column is usually sparse — most people rate and move on. The few who write something are the ones worth reading properly.
What this isn’t
Worth knowing before you plan around it.
- It isn’t anonymous. Names sit beside ratings in Analytics. Say so if you ask for candour.
- It isn’t a survey builder. One rating and one comment box per session — no multiple choice, no branching, no extra questions.
- It isn’t automatic. Feedback appears only on sessions where you added the section.
- It isn’t event-level. Attendees rate sessions, not the event as a whole.
To prompt people to leave feedback, send a push notification — a scheduled one at the end of each day works well. See Send emails & push notifications.
Still need help? Reach our team and we'll get you sorted.
Contact support →